Triggers
A trigger is a recording a sensor makes when shaking crosses its threshold. It keeps the waveform from before the threshold was crossed until the shaking stopped. Sensors on the Structural plan record triggers by default; any sensor can be switched to triggered recording.
Triggers are not earthquake detections. Each one is the shaking at one sensor, whatever caused it: an earthquake, machinery, traffic, construction, or someone bumping the sensor.
The Triggers page
Open Triggers in the sidebar.
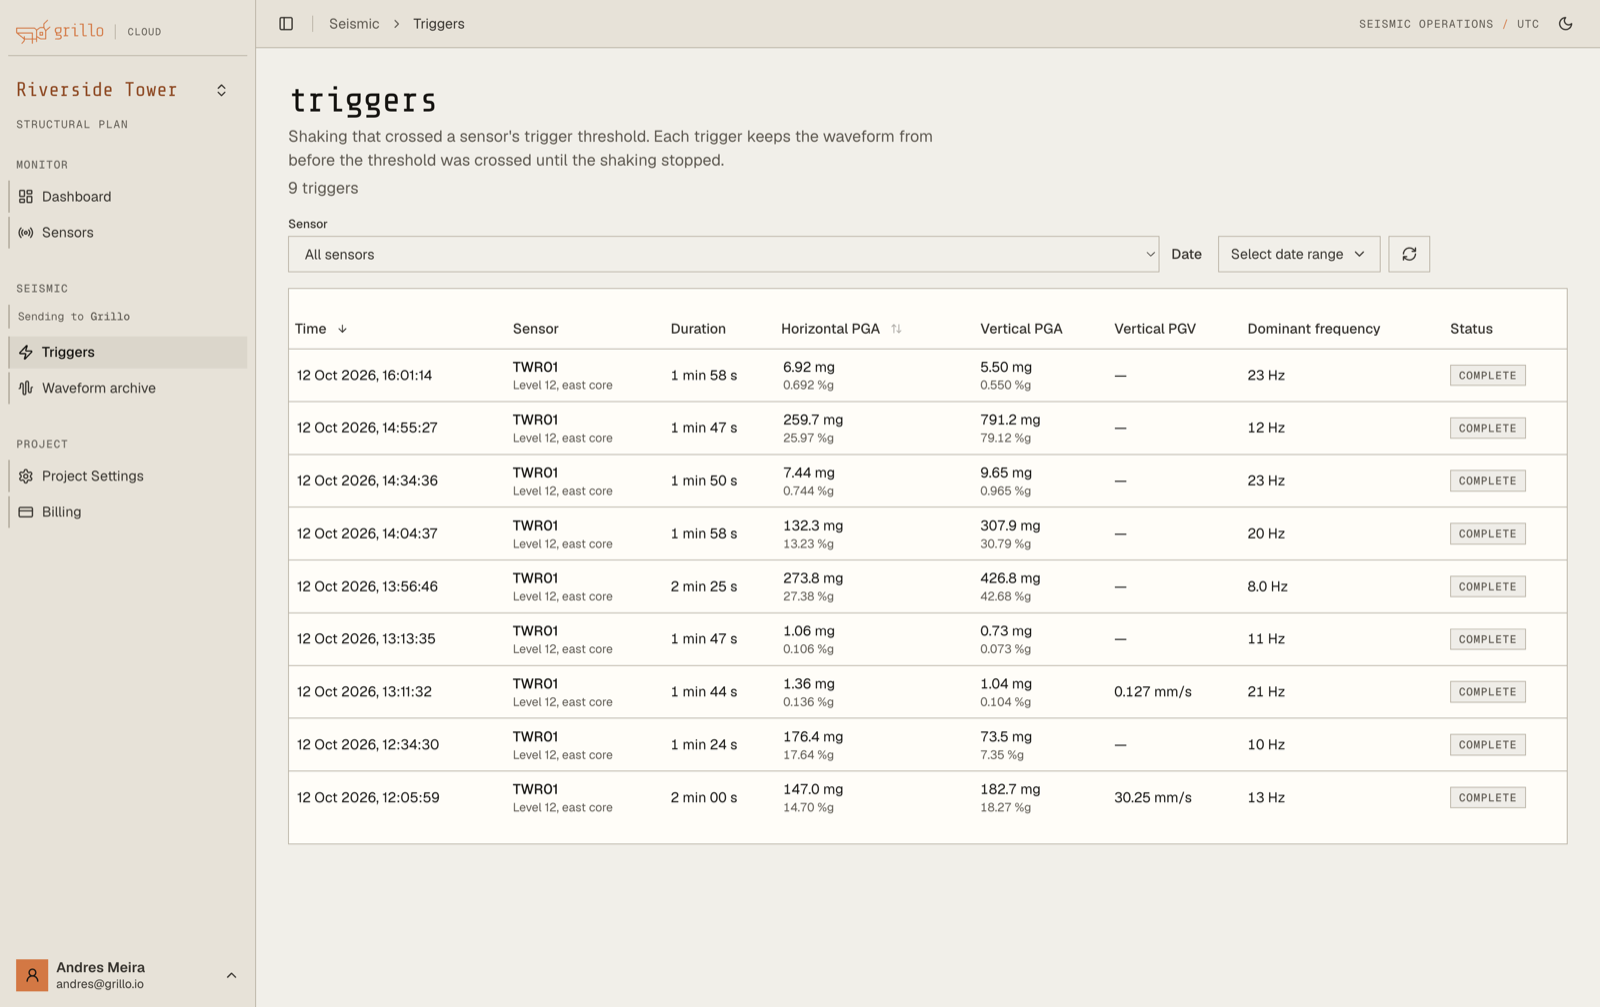
| Column | Meaning |
|---|---|
| Time | When the shaking peaked |
| Sensor | Station code and location name |
| Duration | From the start of the recording to its end |
| Horizontal PGA | Peak ground acceleration on the horizontal axes combined, in mg and %g |
| Vertical PGA | Peak ground acceleration on the vertical axis |
| Vertical PGV | Peak ground velocity on the vertical axis, from the geophone |
| Dominant frequency | The frequency with the most energy at the peak |
| Status | recording… while the sensor is still uploading, then complete |
Select Time or Horizontal PGA to sort. Use Sensor to show one sensor's triggers, and Date to choose a range in UTC. The page shows 50 triggers at a time and refreshes every minute.
Select a trigger to open its details.
Units
- mg is thousandths of the acceleration of gravity: 1000 mg = 1 g = 9.81 m/s².
- %g is the same value as a percentage of gravity: 100 mg = 10 %g.
- Peaks are measured after filtering to 0.5–25 Hz, which removes the sensor's offset and slow drift.
Trigger details
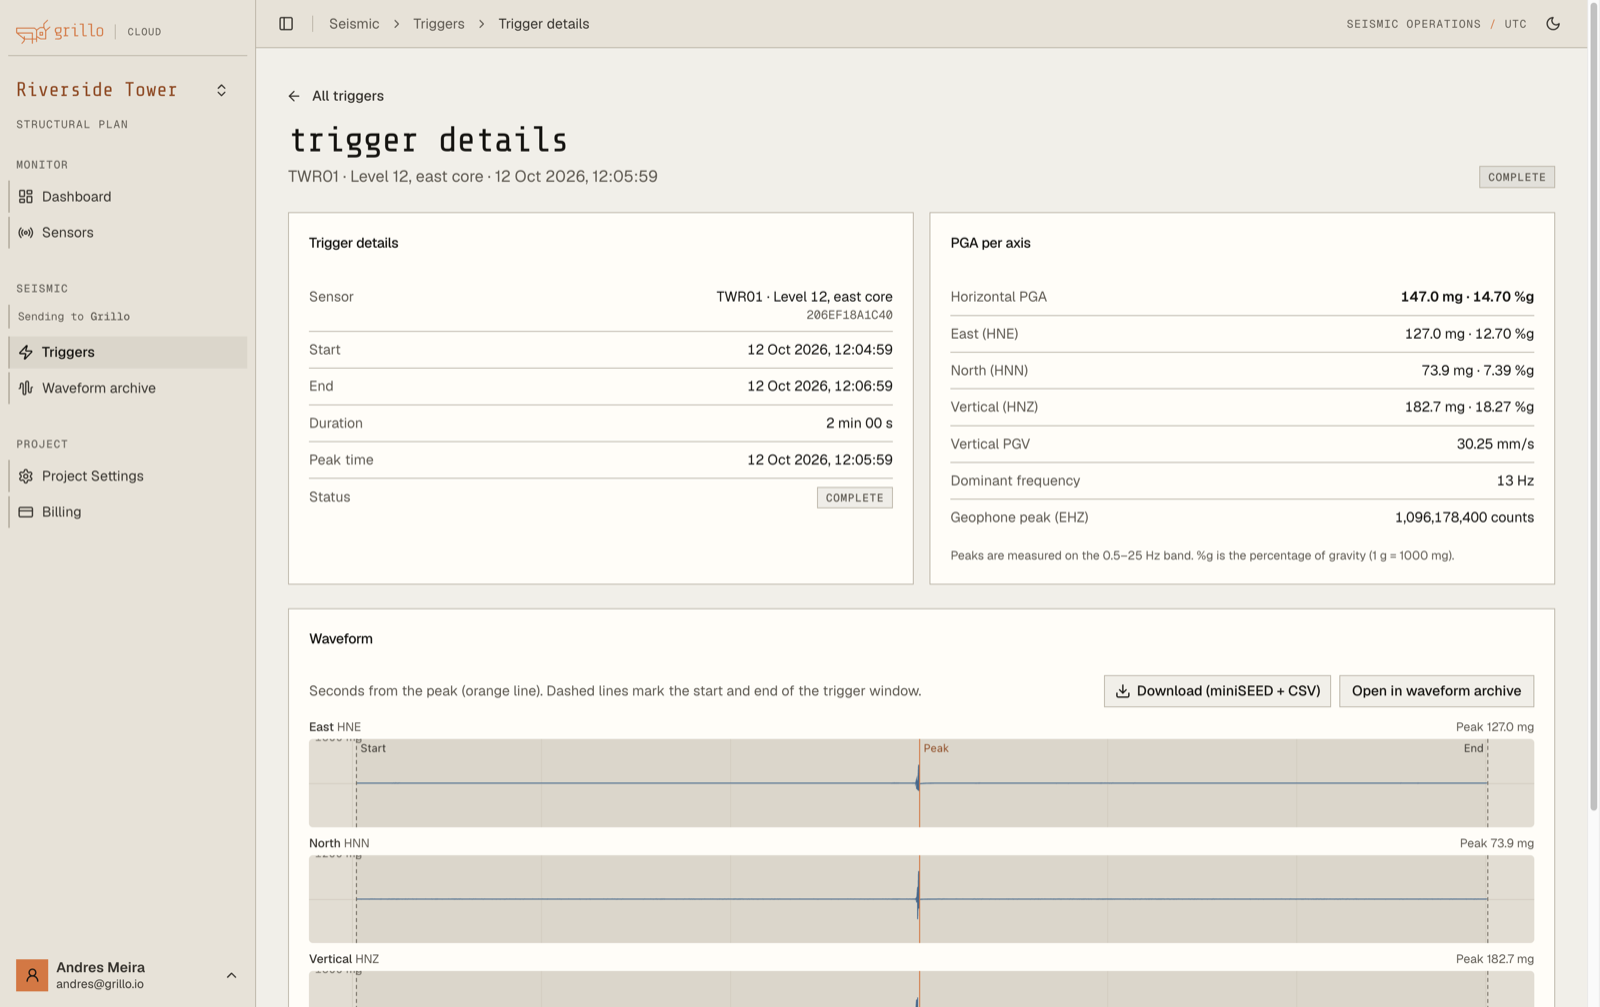
The details show the sensor, the start, end, duration, and peak time, and the peaks:
- Horizontal PGA, and the PGA on each axis: East (HNE), North (HNN), and Vertical (HNZ)
- Vertical PGV in mm/s, for sensors with a calibrated geophone
- Geophone peak (EHZ) in counts
- Dominant frequency
While a trigger is still recording, its values update every 15 seconds as data arrives.
Email alert shows whether an alert was sent for this trigger, and if not, why. See Trigger Alerts.
Waveforms
The Waveform section has one chart per channel: East, North, and Vertical acceleration in mg, and the Geophone in counts. The time axis is seconds from the peak, which is marked by an orange line. Dashed lines labelled Start and End mark the trigger window, and the charts include 5 seconds either side. Shaded bands mark gaps in the data.
A trigger longer than 5 minutes shows the 5 minutes around its peak.
Select Open in waveform archive to look at the same interval in the waveform archive. On plans that include waveform download, Download (miniSEED + CSV) saves the trigger window as a zip file.
Recent triggers for a sensor
Each sensor's details list its 8 most recent triggers. Select View all triggers to open the Triggers page filtered to that sensor.
When a trigger appears
A trigger appears in Grillo Cloud once the sensor starts uploading, usually within a minute of the shaking. It stays recording… while the sensor uploads its pre-event buffer and the shaking, and becomes complete after the sensor stops sending.
- A sensor that keeps shaking for a long time is split into triggers of at most 15 minutes.
- If a sensor's data stops for more than 10 seconds in the middle of a recording, what follows is a new trigger.
If no triggers appear
- Confirm the sensor is online and its details show Triggered.
- Check its threshold. A threshold above the site's normal vibration records nothing until real shaking arrives. To test a sensor, tap the side of the enclosure firmly; the trigger count in its details goes up.
- Check the Date range and the Sensor filter, then select refresh.
If a sensor records too many triggers, raise its threshold. See Recording Mode and Thresholds.
Get triggers by API
Triggers are also available from the Data API.