Event Details
Understanding the detailed information available for each detected earthquake event.
Accessing event details
- Open the event catalog
- Click on an event row
- The event detail view opens
Event detail sections
Header
The top section shows:
- Event ID
- Date and time
- Magnitude (prominent display)
- Location summary
- Event status
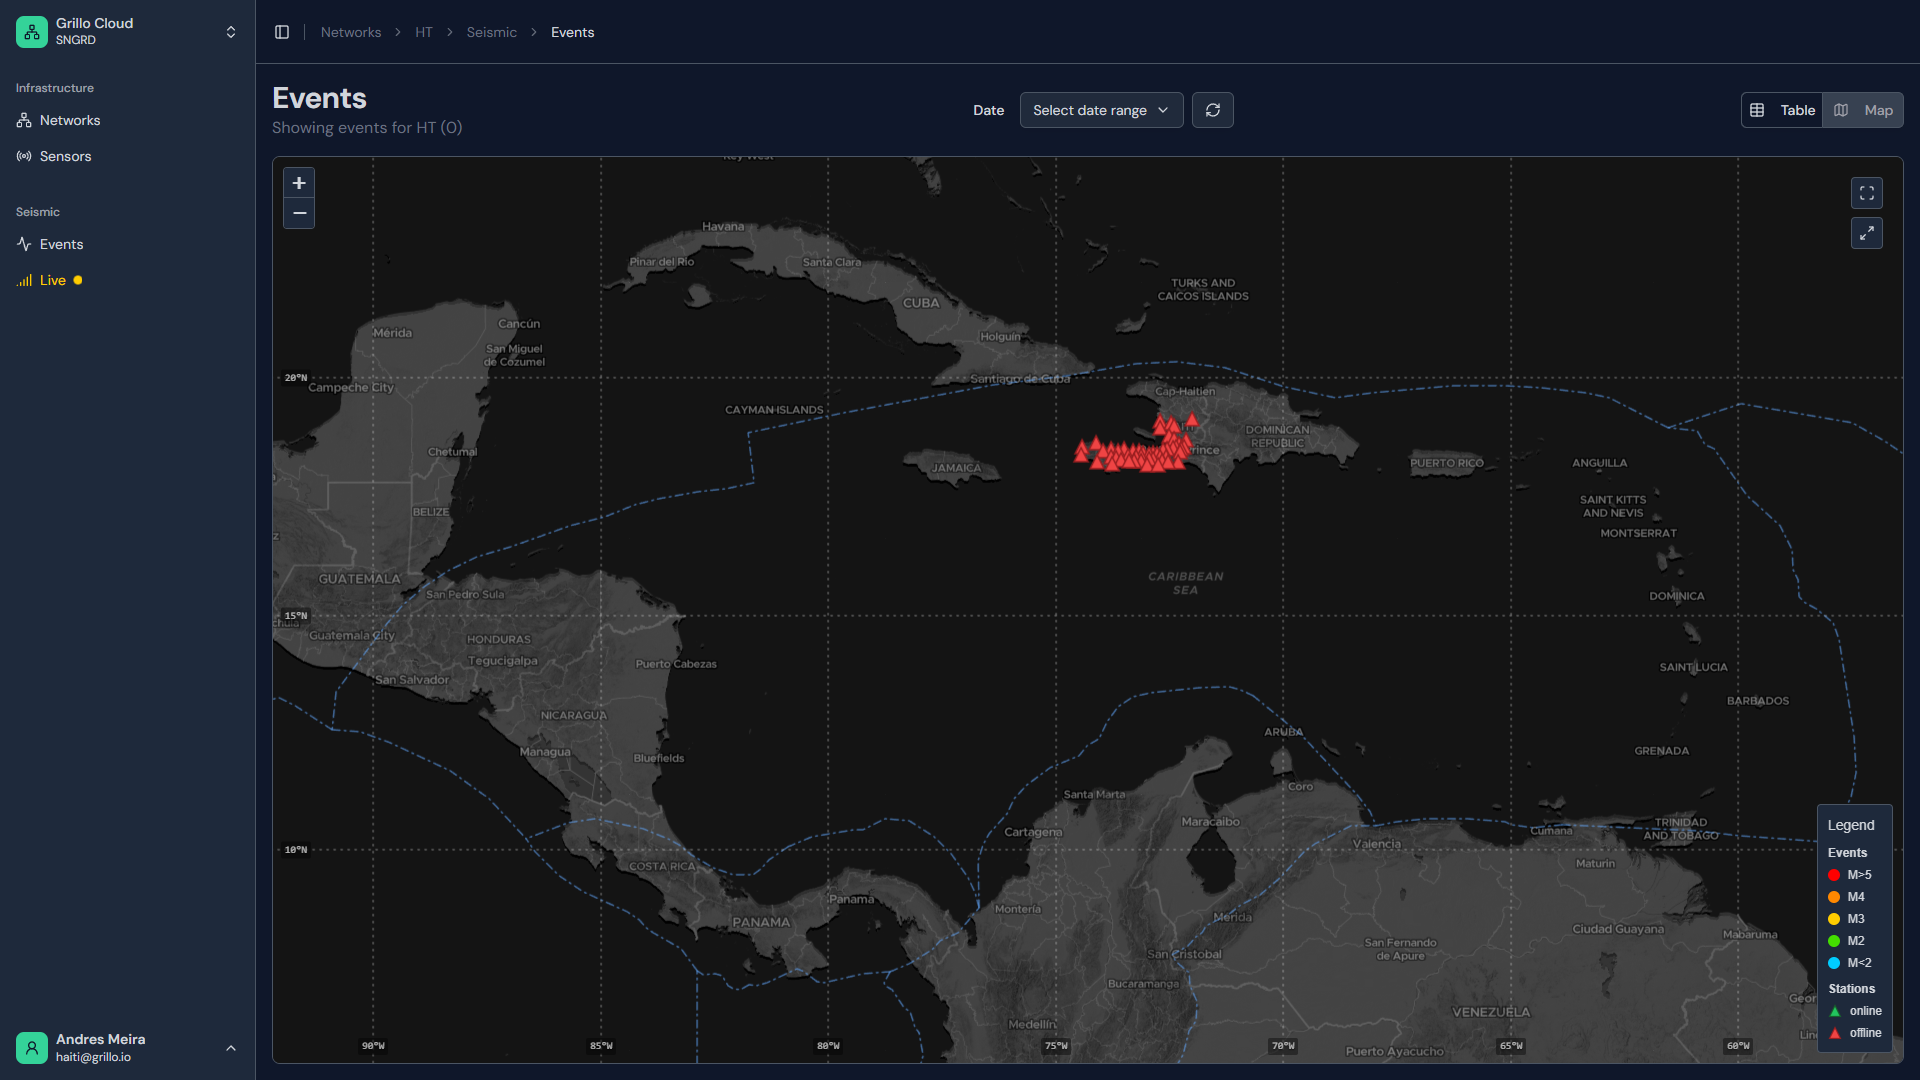
Location map
Interactive map showing:
- Epicenter location (star/circle)
- Station positions (triangles)
- Uncertainty ellipse
- Regional context
Map controls:
- Zoom in/out
- Pan to explore
- Toggle layers
Origin information
Detailed source parameters:
| Parameter | Example | Description |
|---|---|---|
| Origin time | 2024-01-15 14:32:45 UTC | When earthquake occurred |
| Latitude | 37.7749° N | Epicenter latitude |
| Longitude | 122.4194° W | Epicenter longitude |
| Depth | 8.5 km | Depth below surface |
| Location | 5 km NE of City | Geographic reference |
Magnitude information
| Parameter | Example | Description |
|---|---|---|
| Magnitude | 4.2 | Event size |
| Magnitude type | ML (local) | Calculation method |
| Uncertainty | ±0.2 | Margin of error |
Quality metrics
Solution quality indicators:
| Metric | Good | Poor | Description |
|---|---|---|---|
| Stations used | 10+ | Less than 4 | Sensors in solution |
| Azimuthal gap | Less than 90° | More than 180° | Angular coverage |
| RMS residual | Less than 0.5s | More than 2.0s | Fit quality |
| Horizontal error | Less than 5km | More than 20km | Location uncertainty |
| Depth error | Less than 5km | More than 20km | Depth uncertainty |
Station data
Contributing stations
List of sensors that detected the event:
| Column | Description |
|---|---|
| Station | Station code |
| Distance | From epicenter |
| P arrival | P-wave arrival time |
| S arrival | S-wave arrival time |
| Amplitude | Maximum ground motion |
| Residual | Timing residual |
Station map
Map showing:
- Station locations
- Distance circles from epicenter
- Color-coded by amplitude/arrival
Waveforms
Waveform display
View seismic recordings from each station:
- Time-aligned to event
- Filtered display options
- P and S picks marked
Waveform controls
| Control | Function |
|---|---|
| Zoom | Expand time/amplitude |
| Pan | Scroll through time |
| Filter | Apply frequency filter |
| Stack | Overlay multiple traces |
Amplitude information
Peak ground motion values:
- PGA (Peak Ground Acceleration)
- PGV (Peak Ground Velocity)
- Response spectra (if available)
Event timeline
For rapidly updating events:
- Initial detection time
- Parameter updates
- Final solution time
- Alert delivery times
Comparing events
View this event in context:
- Similar past events
- Regional seismicity
- Sequence analysis (aftershocks)
Event status
Automatic
Initial automatic solution:
- Generated by algorithm
- May be revised
- "Preliminary" label
Reviewed
After human review:
- Quality checked
- Parameters verified
- "Reviewed" label
Final
Authoritative solution:
- No further changes expected
- Published to catalog
- "Final" label
Actions
Available actions for events:
| Action | Description |
|---|---|
| Export | Download event data |
| Share | Get shareable link |
| Report | Flag issue with event |
| Print-friendly view |
Export options
Export individual event:
- Full parameter file
- Waveform data
- Station data
- Maps and images
Formats:
- QuakeML (standard format)
- JSON
- CSV
- PDF report
Understanding uncertainties
Location uncertainty
Shown as an error ellipse on the map:
- Semi-major axis length
- Semi-minor axis length
- Orientation
Smaller ellipse = more confident location.
Magnitude uncertainty
Expressed as ± value:
- M 4.2 ±0.2 means likely between 4.0-4.4
- Uncertainty decreases with more stations
Why uncertainties vary
| Factor | Effect on uncertainty |
|---|---|
| More stations | Lower uncertainty |
| Better distribution | Lower uncertainty |
| Higher magnitude | Lower uncertainty |
| Station noise | Higher uncertainty |