Live Map
The Live Map provides a real-time visualization of seismic activity across your network, showing station detections and earthquake wave propagation as they happen.
Overview
The Live Map is your window into what's happening right now:
- Station detections - See which sensors are detecting ground motion
- Earthquake visualization - Watch P and S waves propagate outward from the epicenter
- Real-time updates - Data refreshes continuously as events unfold
Accessing the Live Map
- Navigate to your network
- Click "Live Map" in the sidebar or top navigation
- The live visualization will begin streaming
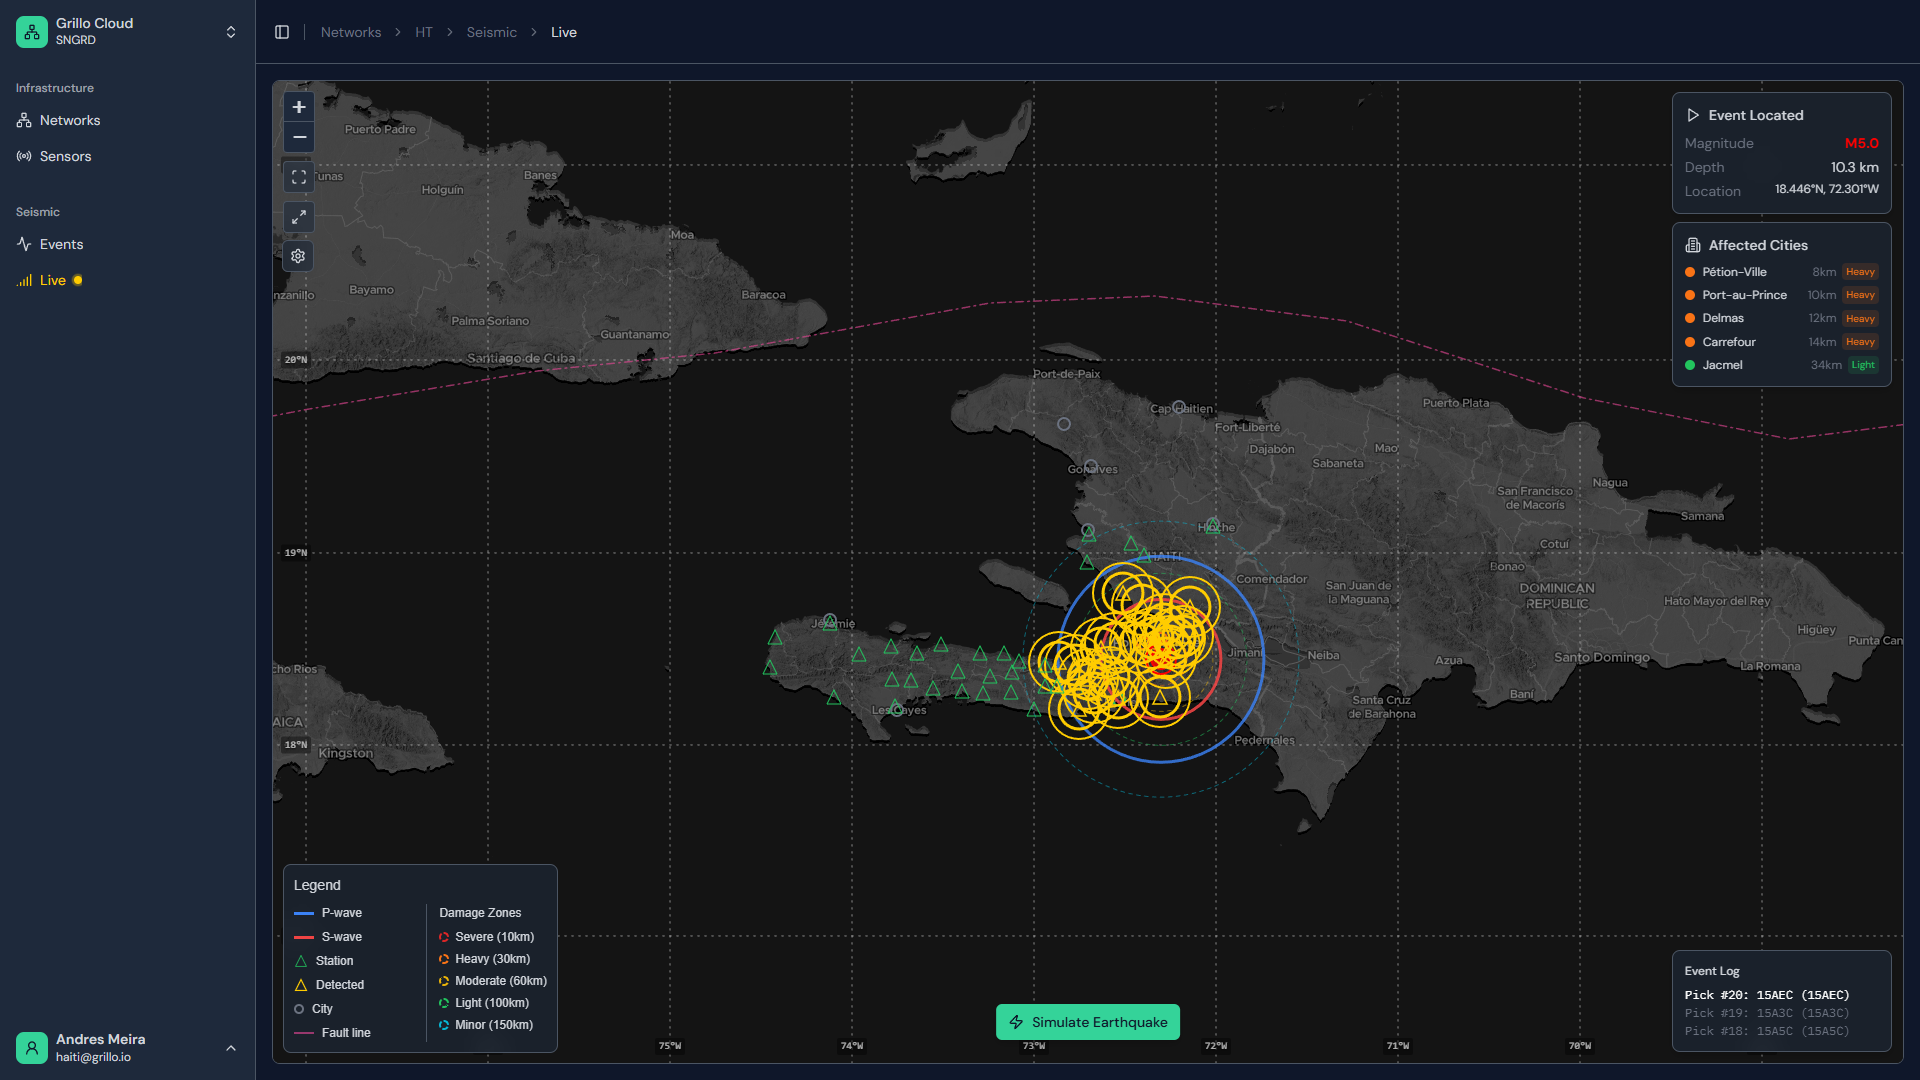
Understanding the display
Station indicators
Stations change appearance based on current activity:
| Indicator | Meaning |
|---|---|
| Idle (gray/green) | No significant motion detected |
| Triggered (yellow) | Elevated ground motion detected |
| Alert (red) | Strong motion / event detection |
| Pulsing | Currently receiving data |
Wave propagation circles
When an earthquake is detected, expanding circles show wave propagation:
| Circle | Color | Description |
|---|---|---|
| P-wave | Blue | Primary wave - fastest, arrives first |
| S-wave | Red/Orange | Secondary wave - slower, more destructive |
The circles expand outward from the epicenter at the approximate speed of seismic waves, showing:
- Which stations have already been reached
- Which stations will be affected next
- Estimated arrival times at each location
Epicenter marker
The earthquake source is shown as:
- A star or circle at the epicenter location
- Magnitude displayed nearby
- Click for event details
Real-time features
Detection timeline
As an event unfolds:
- First detection - Initial station triggers, shown on map
- Event located - Epicenter calculated, waves begin expanding
- Wave propagation - Circles expand showing P and S wave fronts
- Station alerts - Each station highlights as waves arrive
- Event complete - Waves pass through network, event cataloged
Station triggering
Watch stations respond in real-time:
- Stations flash or pulse when detecting motion
- Color intensity indicates ground motion amplitude
- Triggering pattern helps confirm real events vs. noise
Map controls
Playback controls
| Control | Function |
|---|---|
| Play/Pause | Start or stop live updates |
| Speed | Adjust visualization speed (1x, 2x, 5x) |
| Rewind | Replay recent events |
View controls
| Control | Function |
|---|---|
| Zoom | Mouse wheel or +/- buttons |
| Pan | Click and drag |
| Center | Reset to network center |
| Fullscreen | Expand to full screen |
Layer toggles
Show or hide map elements:
- Station markers
- Wave propagation circles
- Epicenter markers
- Station labels
- Terrain/satellite imagery
Event information panel
When an event is active or selected:
- Magnitude - Current estimate (may update)
- Location - Epicenter coordinates and description
- Depth - Estimated depth
- Time - Origin time
- Status - Detecting / Located / Complete
- Stations triggered - Count and list
Using the Live Map effectively
During an earthquake
- Watch the detection pattern spread across your network
- Note which stations trigger first (closest to epicenter)
- Observe wave propagation to estimate event location
- Monitor magnitude estimates as more data arrives
For monitoring
- Keep the Live Map open on a dedicated display
- Enable sound alerts for significant events
- Use the timeline to review recent activity
For presentations
- Replay past events to demonstrate detection capabilities
- Adjust playback speed to show wave propagation clearly
- Use fullscreen mode for better visibility
Settings
Alert thresholds
Configure when visual alerts appear:
- Minimum magnitude to display
- Detection confidence threshold
- Alert colors and sounds
Display preferences
| Setting | Options |
|---|---|
| Wave speed | Real-time, accelerated |
| Circle opacity | Solid to transparent |
| Station size | Small, medium, large |
| Auto-center | On new events, never |
Performance
For networks with many sensors:
- Reduce animation detail
- Limit displayed time window
- Use simplified wave graphics
Mobile access
The Live Map works on mobile devices:
- Touch to pan and zoom
- Tap stations for info
- Landscape mode recommended
- May have reduced animation detail
Troubleshooting
Map not updating
- Check internet connection
- Verify the play button is active
- Refresh the page
- Check if there are any active events
Waves not displaying
- Ensure an event is currently active or selected
- Check layer toggles - waves may be hidden
- Zoom out to see the full propagation area
- Verify events subscription is active
Performance issues
- Reduce animation quality in settings
- Close other browser tabs
- Try a different browser
- Use a wired internet connection