Map View
The map view provides a geographic visualization of your sensors, showing their locations and status at a glance.
Accessing map view
- Navigate to your network
- Click the "Map" tab or icon
- The map will display all sensors in the network
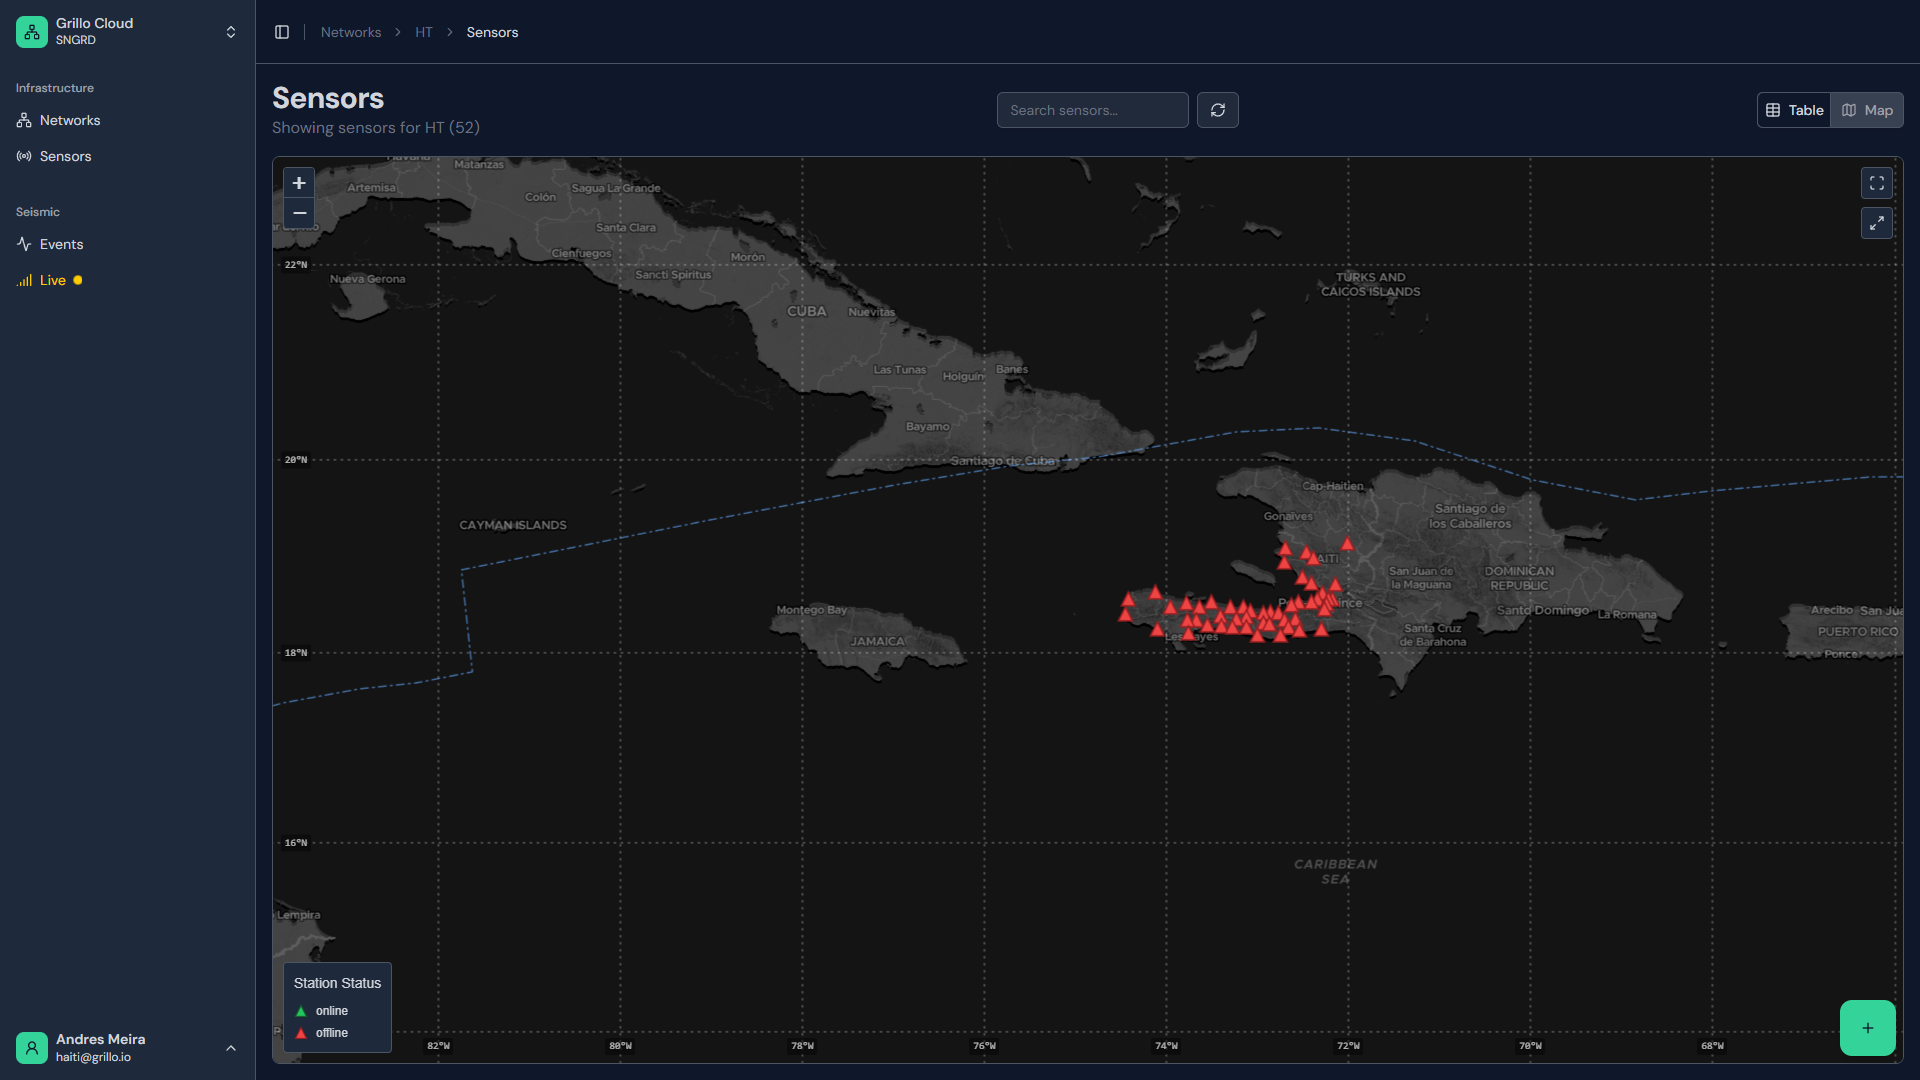
Map interface
Sensor markers
Sensors are displayed as markers on the map:
| Marker color | Status |
|---|---|
| Green | Online - connected and streaming |
| Gray | Offline - not currently connected |
| Yellow | Warning - connected with issues |
| Red | Error - problem requiring attention |
Map controls
| Control | Function |
|---|---|
| Zoom in/out | Mouse wheel or +/- buttons |
| Pan | Click and drag |
| Reset view | Click the home/reset button |
| Fullscreen | Click fullscreen button |
Layers
Toggle map layers:
- Satellite - Satellite imagery
- Terrain - Topographic view
- Streets - Road map view
- Events - Show detected events (if enabled)
Interacting with sensors
Quick info popup
Click on a sensor marker to see:
- Sensor name/station code
- Current status
- Last data timestamp
- Quick action links
Sensor detail pane
Click "View details" in the popup to open the full sensor detail pane.
Cluster view
When zoomed out, nearby sensors may cluster:
- Clusters show the count of sensors
- Click a cluster to zoom in
- Colors indicate overall cluster status
Filtering sensors
By status
Filter to show only certain statuses:
- Click the "Filter" button
- Select status types to show:
- Online
- Offline
- Warning
- Error
- Map updates to show filtered sensors
By sensor type
Filter by device type:
- Grillo One
- Grillo Pulse
By search
Search for specific sensors:
- Use the search box
- Enter station name or serial number
- Matching sensors are highlighted
Map features
Auto-fit
The map automatically fits to show all sensors when loaded. To re-fit:
- Click the "Fit to bounds" button
- Map will zoom to include all sensors
Current location
If location permissions are granted:
- Your location appears as a blue dot
- Helpful when visiting sensor sites
Scale bar
The scale bar shows the current map scale:
- Adjusts as you zoom
- Displays in km or miles based on preferences
Events on map
If your network has event detection enabled:
Event markers
- Events appear as star or circle markers
- Color indicates magnitude or age
- Click for event details
Event visualization
- Shakemaps may be displayed
- Waveform animations available
- Event history can be shown
Map settings
Configuring the map
Access map settings via the gear icon:
| Setting | Description |
|---|---|
| Default zoom | Initial zoom level |
| Map style | Default layer type |
| Cluster threshold | When to cluster markers |
| Auto-refresh | How often to update |
Saving views
Save custom map views:
- Set up your preferred view
- Click "Save view"
- Name the view
- Access saved views from the dropdown
Exporting
Screenshot
Export the current map view as an image:
- Click the export/download button
- Choose image format (PNG, JPG)
- Image is downloaded
Print
Print the current map view:
- Click the print button
- Adjust print settings
- Print or save as PDF
Tips for effective use
Organizing sensor visibility
- Use clear location coordinates for accurate placement
- Configure sensor names for easy identification
- Use consistent naming conventions
Performance
For networks with many sensors:
- Use clustering to improve performance
- Filter to show only relevant sensors
- Consider using table view for large lists
Mobile use
The map works on mobile devices:
- Pinch to zoom
- Swipe to pan
- Tap for sensor info
Troubleshooting
Sensors not appearing on map
- Verify sensors have location coordinates set
- Check if sensors are filtered out
- Ensure map is zoomed to correct area
- Try refreshing the page
Map not loading
- Check internet connection
- Try a different browser
- Clear browser cache
- Disable browser extensions
Wrong sensor locations
- Verify coordinates in sensor settings
- Check coordinate format (decimal degrees)
- Update location information