Table View
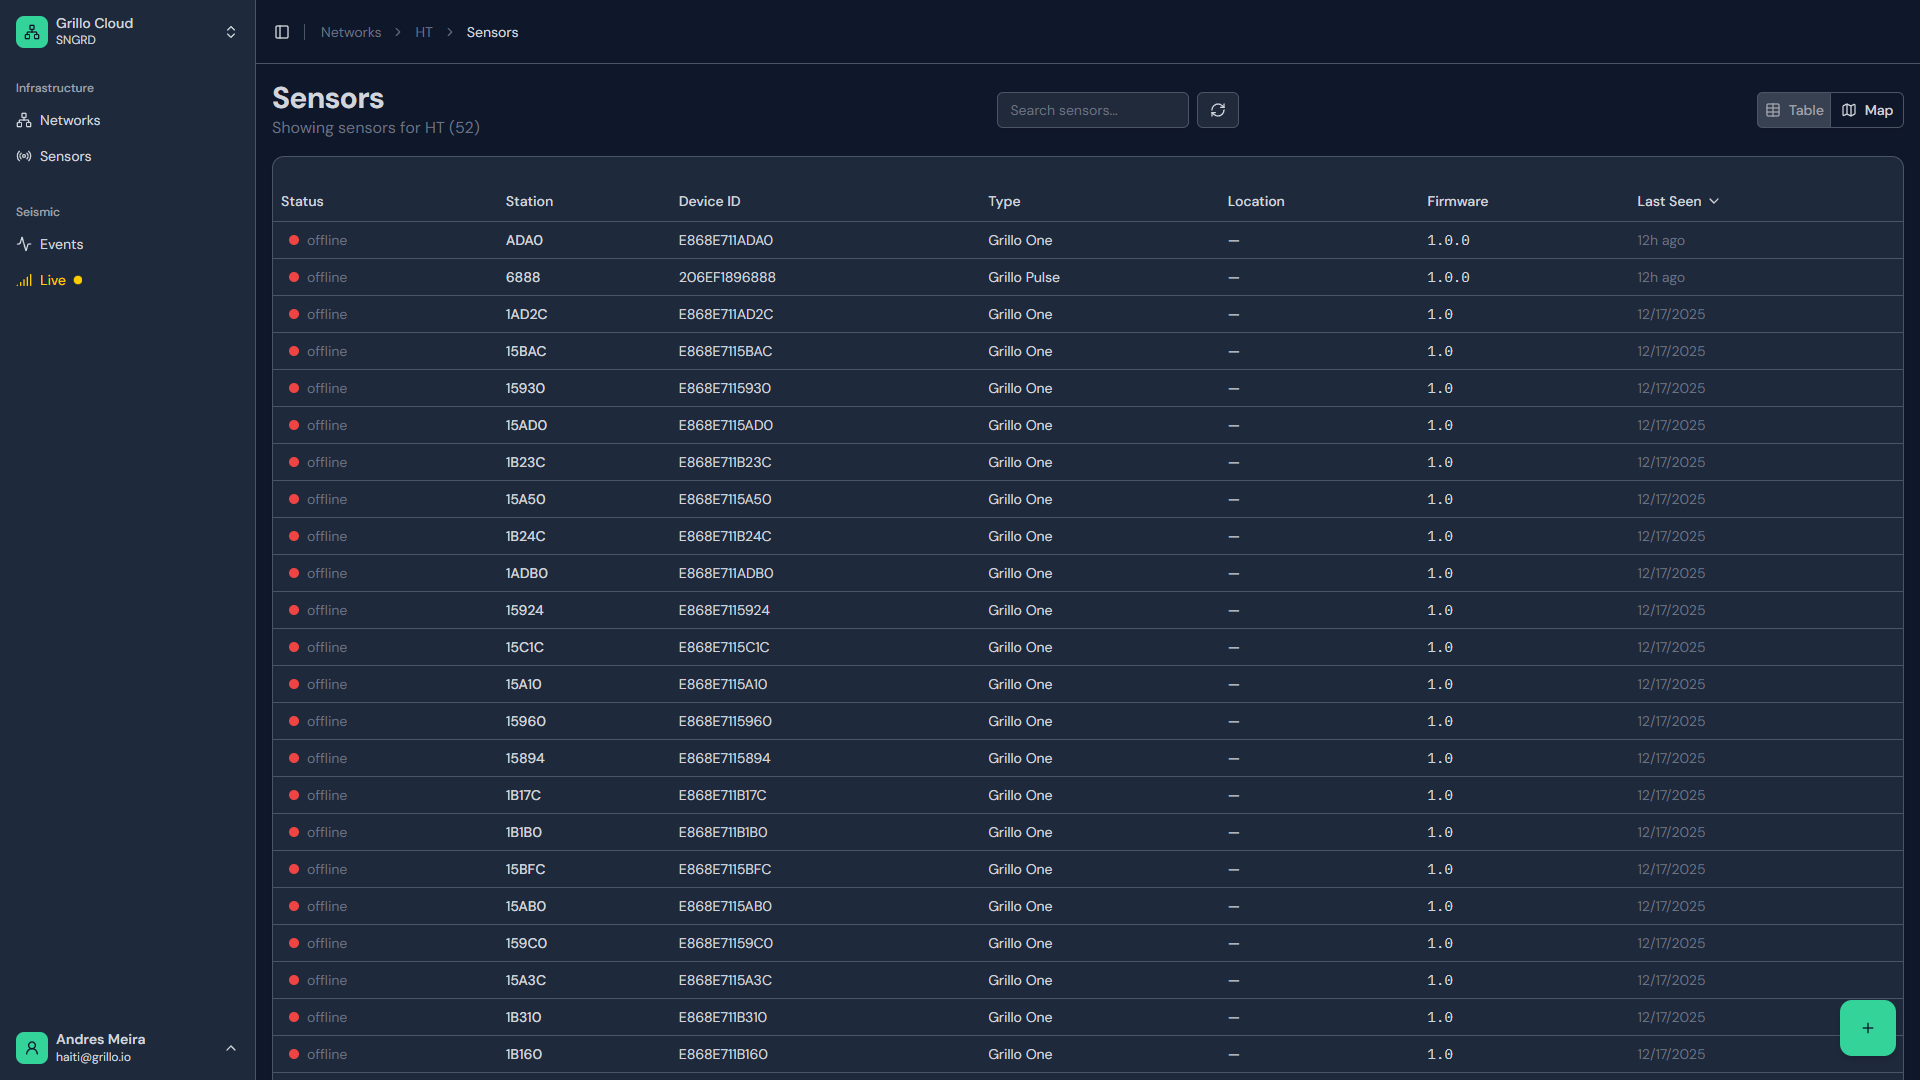
The table view displays your sensors in a sortable, filterable list format, ideal for managing many sensors.
Accessing table view
- Navigate to your network
- Click the "Table" tab or list icon
- Sensors are displayed in a table format

Table columns
Default columns
| Column | Description |
|---|---|
| Status | Online/Offline/Warning indicator |
| Station | Station code (FDSN format) |
| Name | Sensor display name |
| Type | Grillo One or Grillo Pulse |
| Last seen | Last data received timestamp |
| Location | Coordinates or location name |
Additional columns
Click "Columns" to show/hide:
- Serial number
- Network name
- Installation date
- Firmware version
- Signal strength
- Battery level (Pulse only)
Sorting
Single column sort
Click a column header to sort:
- First click: Sort ascending (A-Z, oldest first)
- Second click: Sort descending (Z-A, newest first)
- Third click: Clear sort
Multi-column sort
Hold Shift and click additional columns to add secondary sorts.
Filtering
Quick filters
Use preset filters at the top:
- All - Show all sensors
- Online - Only online sensors
- Offline - Only offline sensors
- Issues - Sensors with warnings/errors
Column filters
Filter by specific column values:
- Click the filter icon in a column header
- Select or enter filter criteria
- Apply the filter
Search
Use the search box to find sensors:
- Search by station name
- Search by serial number
- Search by location
Selecting sensors
Single selection
Click a row to select a sensor:
- Opens the sensor detail pane
- Or highlights for action
Multi-selection
Select multiple sensors for bulk operations:
- Click the checkbox in the first column
- Or use Shift+Click for a range
- Or use Ctrl+Click for individual selections
Bulk operations
When multiple sensors are selected:
| Action | Description |
|---|---|
| Export | Export data for selected sensors |
| Update | Apply settings to multiple sensors |
| Remove | Remove selected from network |
Pagination
For networks with many sensors:
Page controls
- Navigate between pages with arrows
- Jump to specific page number
- Change items per page (25, 50, 100)
Showing count
The table shows:
- "Showing X-Y of Z sensors"
- Total count updates with filters
Exporting data
Export table
Export the current table view:
- Apply desired filters/sorts
- Click "Export" button
- Choose format (CSV, Excel)
- Download the file
Export contents
The export includes:
- All visible columns
- Applied filters
- Current sort order
Customizing the table
Column order
Drag column headers to reorder:
- Click and hold a column header
- Drag to new position
- Release to place
Column width
Resize columns:
- Hover over column border
- Drag to resize
- Double-click border to auto-fit
Save layout
Save your custom table configuration:
- Set up preferred columns and order
- Click "Save layout"
- Layout persists for future sessions
Status indicators
Status column icons
| Icon | Meaning |
|---|---|
| Green dot | Online and streaming |
| Gray dot | Offline |
| Yellow triangle | Warning condition |
| Red circle | Error condition |
Last seen column
Shows when data was last received:
- "Just now" - Within last minute
- "5 min ago" - Recent data
- "2 hours ago" - May indicate issue
- "1 day ago" - Likely offline
Keyboard navigation
| Key | Action |
|---|---|
| Up/Down | Navigate rows |
| Enter | Open selected sensor |
| Escape | Clear selection |
| Ctrl+F | Focus search box |
Mobile view
On mobile devices:
- Table scrolls horizontally
- Fewer columns shown by default
- Tap row to view details
- Use responsive menu for actions
Troubleshooting
Table not loading
- Check internet connection
- Refresh the page
- Try a different browser
- Clear browser cache
Filters not working
- Check filter syntax
- Clear all filters and reapply
- Refresh the page
Columns missing
- Check "Columns" menu
- Enable desired columns
- Reset to default if needed