Sensor Details
The sensor detail pane provides comprehensive information about a single sensor, including real-time data, configuration, and health metrics.
Opening sensor details
Access sensor details by:
- Clicking a sensor on the map
- Clicking a row in the table view
- Using the search to find a sensor
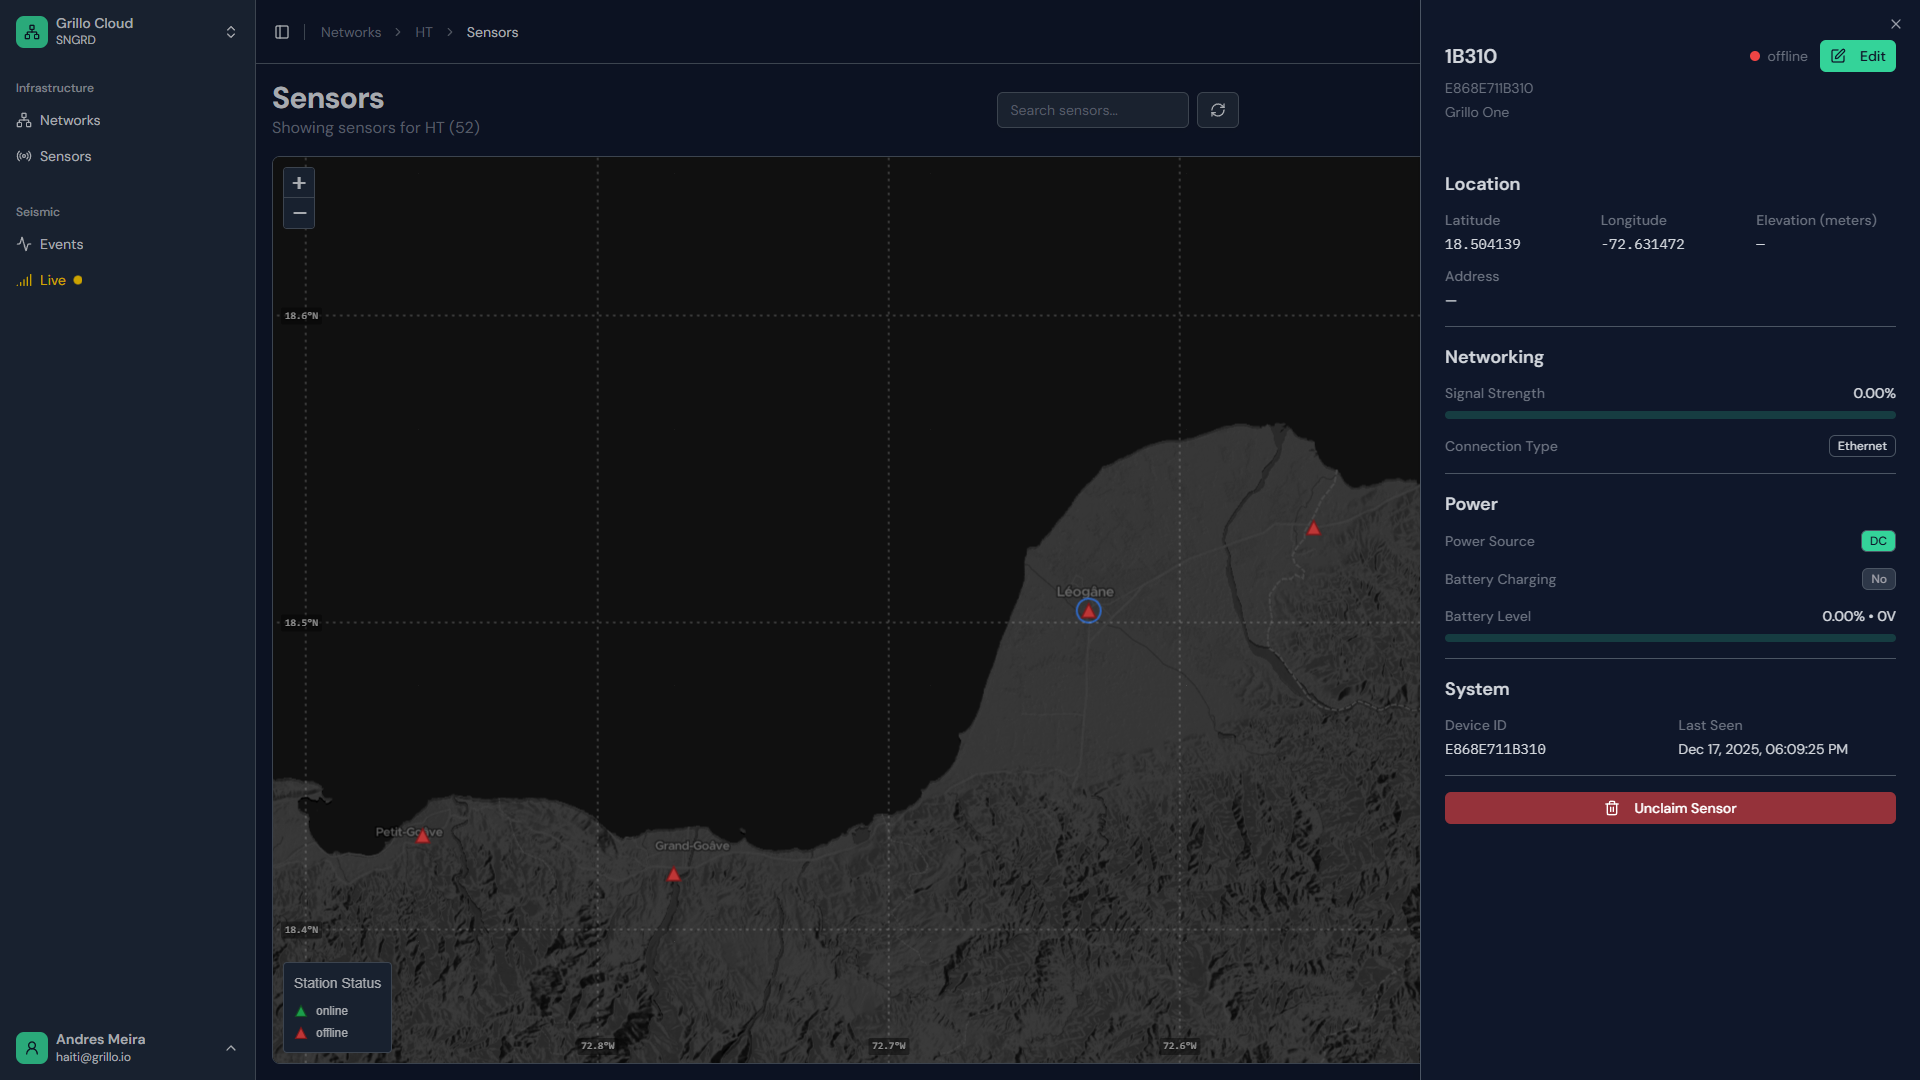
Detail pane sections
Header
The top of the pane shows:
- Station name - FDSN station code
- Status indicator - Online/Offline/Warning
- Quick actions - Edit, Remove, etc.
- Sensor type - Grillo One or Grillo Pulse
Status section
Current sensor status:
| Field | Description |
|---|---|
| Connection | Online/Offline status |
| Last seen | Timestamp of last data |
| Uptime | Time since last restart |
| Signal | WiFi or cellular signal strength |
| Battery | Battery level (Pulse only) |
Location section
Geographic information:
| Field | Description |
|---|---|
| Coordinates | Latitude, longitude |
| Elevation | Height above sea level |
| Address | Physical address (if entered) |
| Site | Site description or notes |
Configuration section
Current settings:
| Field | Description |
|---|---|
| Station code | FDSN station identifier |
| Network code | Network identifier |
| Location code | Location identifier |
| Channel codes | Data channels |
| Sample rate | Data sampling frequency |
Device section
Hardware information:
| Field | Description |
|---|---|
| Serial number | Unique device identifier |
| Device type | Grillo One / Grillo Pulse |
| Firmware | Current firmware version |
| Hardware | Hardware revision |
Real-time data
Live waveform
If the sensor is online, you may see:
- Real-time waveform display
- Data from last few minutes
- Zoom and pan controls
Data quality indicators
Visual indicators for data quality:
- Sample rate consistency
- Gap detection
- Noise levels
Tabs
Overview tab
Summary of sensor status and key information (default view).
Data tab
Detailed data views:
- Waveform history
- Data downloads
- Quality metrics
Configuration tab
All configurable settings:
- Station information
- Location details
- Advanced parameters
History tab
Historical information:
- Status changes
- Configuration changes
- Alert history
Quick actions
Actions available from the detail pane:
| Action | Description |
|---|---|
| Edit | Open configuration editor |
| Locate | Center map on this sensor |
| Download | Export sensor data |
| Restart | Remote sensor restart |
| Remove | Remove from network |
Status details
Online status
When online, you'll see:
- Green status indicator
- Recent timestamp
- Active data stream
- Signal strength
Offline status
When offline:
- Gray status indicator
- Last seen timestamp
- No live data
- Possible reasons
Warning status
Yellow indicator means:
- Connected but with issues
- Data quality problems
- Low battery (Pulse)
- Weak signal
Error status
Red indicator means:
- Critical issue detected
- Requires immediate attention
- Check error details
Notifications
Sensor alerts
Configure alerts for this sensor:
- Status change notifications
- Data quality alerts
- Battery warnings
Closing the pane
Close the detail pane by:
- Clicking the X button
- Clicking outside the pane
- Pressing Escape
- Selecting a different sensor
Mobile view
On mobile devices:
- Pane opens as full-screen
- Swipe to navigate tabs
- Use back button to close
Troubleshooting
Details not loading
- Check internet connection
- Refresh the page
- Verify sensor exists
- Check your permissions
Data not updating
- Verify sensor is online
- Check for connectivity issues
- Refresh the pane
- Check data latency
Configuration not saving
- Check internet connection
- Verify you have edit permissions
- Review error messages
- Try again or contact support